Bitcoin Breaks 365‑Day Moving Average and Long‑Term Trendline, Signaling Bullish Momentum
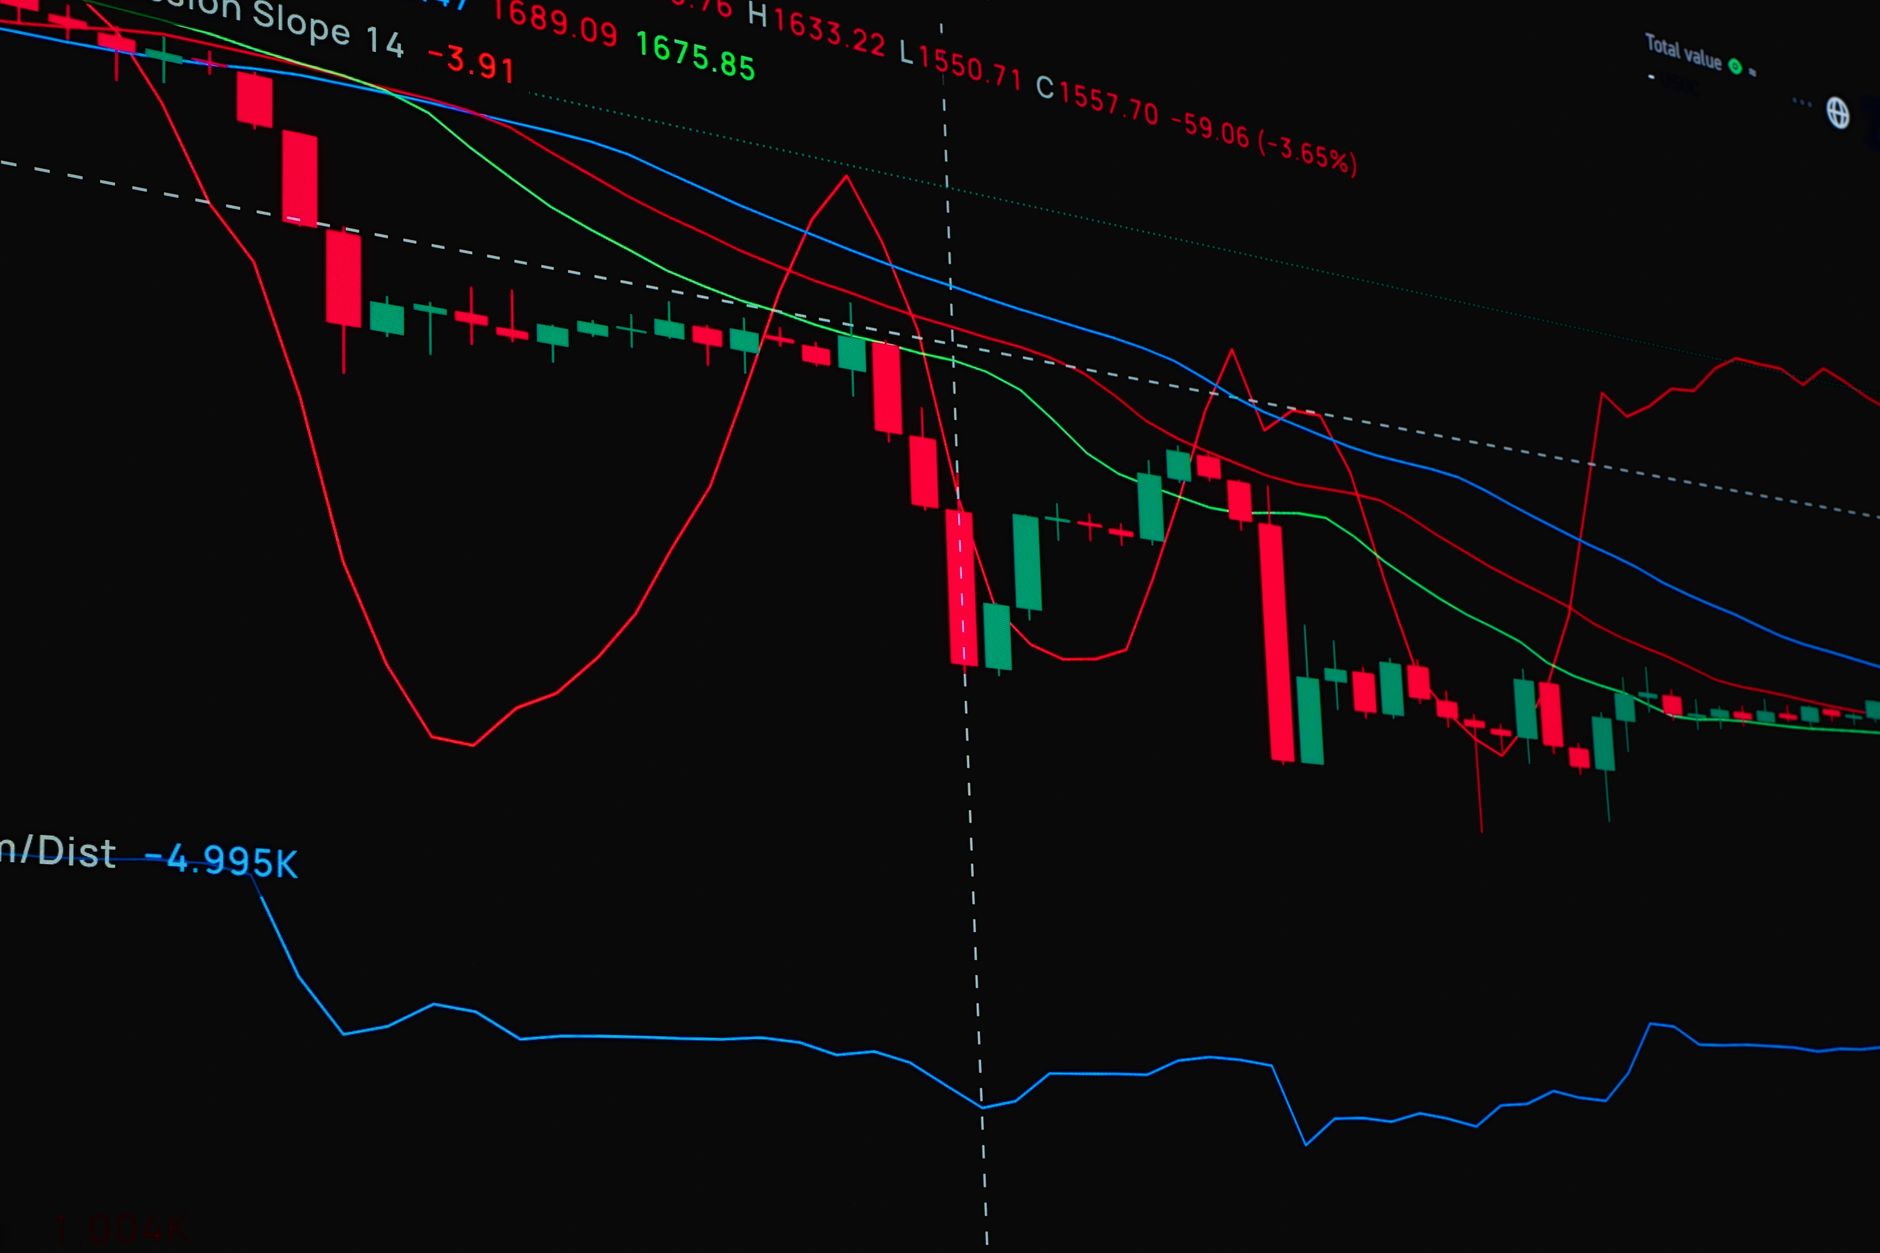
Bitcoin closed above its 365‑day moving average for the first time since March 2023 and simultaneously pierced a long‑term trendline that has historically marked the start of every bull run since 2019, propelling the market into the $85,897 price zone and beyond the $80,500 psychological barrier.
Key Takeaways
- Bitcoin’s price cleared the 365‑day moving average, a milestone not seen since March 2023.
- The breakout shattered a trendline that has reliably signaled bull markets since 2019.
- On‑chain metrics—MVRV ratio and SOPR index—both turned bullish, indicating strong spot demand.
- Large holders aligned with exchange traders for the first time in three years, ending a prolonged downtrend.
- The sell‑order wall that persisted since mid‑August 2026 was absorbed during the surge.
| Metric | Value | Why it matters |
|---|---|---|
| 365‑day MA breach | First above since March 2023 | Signals a shift from long‑term bearish bias. |
| Trendline break | Long‑term line that predicted bull runs since 2019 | Historical reliability adds confidence to the uptrend. |
| Price level | $85,897 zone, crossing $80,500 | Moves market into a confirmed uptrend zone. |
| MVRV ratio | Crossed above long‑term average | Indicates sustained upward momentum. |
| SOPR index | Profit‑taking absorbed by spot demand | Shows buying pressure outweighs selling. |
| Whale behavior | Large holders moved with exchange traders (first time in three years) | Breaks prolonged downtrend, supports bullish bias. |
What the Breakout Represents
The confluence of a 365‑day moving average crossover and a breach of a historically predictive trendline creates a rare technical alignment. Traders who track long‑term cycles view the 365‑day average as a proxy for the market’s underlying sentiment, while the trendline has “accurately predicted the start of every bull run since 2019,” making its violation a potent bullish signal.
On‑Chain Confirmation from MVRV and SOPR
Glassnode reported that the MVRV ratio—market value to realized value—has crossed above its long‑term average, entering a zone associated with sustained upward momentum. In parallel, CryptoQuant’s SOPR index showed that profit‑taking attempts are being immediately absorbed by strong spot demand, suggesting that sellers are unable to push price lower despite attempts to realize gains.
Whale Activity Aligns with Exchange Traders
For the first time in three years, large capital holders moved in the same direction as exchange traders, technically breaking the prolonged downtrend that has characterized recent market behavior. This alignment reduces the risk of a sudden reversal caused by coordinated sell‑offs and adds credibility to the emerging uptrend.
Absorption of the Mid‑August Sell‑Wall
A massive wall of sell orders that had been in place since mid‑August 2026 was absorbed as price surged into the $85,897 zone. The ability to clear such entrenched resistance demonstrates robust buying pressure and suggests that the market may have cleared a key liquidity barrier.
Historical Context and Future Outlook
Since the trendline’s inception, each breach has preceded a multi‑month rally, reinforcing the notion that technical patterns retain predictive power even in a market increasingly driven by on‑chain dynamics. With the 365‑day moving average now behind the price, the next technical hurdle will be sustaining momentum above the $80,500 psychological level and testing higher resistance zones.
Why it Matters
The simultaneous validation from price action, on‑chain metrics, and whale behavior reduces the probability of a false breakout. Traders and HODLers should monitor the MVRV ratio and SOPR for signs of weakening demand, while also watching for any re‑emergence of large sell walls that could stall the rally.
Frequently asked questions
What technical milestone did Bitcoin achieve?
It closed above its 365‑day moving average for the first time since March 2023 and broke a long‑term trendline that has signaled every bull run since 2019.
Which on‑chain indicators turned bullish?
The MVRV ratio crossed above its long‑term average, and the SOPR index showed profit‑taking being absorbed by spot demand.
How did large holders behave during the breakout?
For the first time in three years, they moved in the same direction as exchange traders, effectively ending a prolonged downtrend.
What was the significance of the sell‑order wall?
A wall that had persisted since mid‑August 2026 was cleared as price entered the $85,897 zone, indicating strong buying pressure.
Which analytics platforms provided the data?
Glassnode supplied the MVRV insight, while CryptoQuant and its researchers contributed SOPR analysis and commentary.
Bottom Line
Bitcoin’s breach of both the 365‑day moving average and a historically reliable trendline, reinforced by bullish on‑chain metrics and coordinated whale activity, marks a strong long‑term bullish signal that traders should watch closely as the market tests higher resistance levels.
The next weeks will reveal whether demand can sustain above $80,500 and whether new sell‑walls emerge, shaping the trajectory of the next bull phase.
Crypto is highly volatile and risky. This is not financial advice — do your own research.
Reporting based on: original source.


Comments
Post a Comment